

Top 50 richest countries in the world
Top 50 richest countries in the world--What actually comes to the mind of everyone when they try to ponder about the richest countries in the world? And what comes to mind when they think about the Top 100 largest countries by area
How to determine how rich a country is and compare it with the others? Of course, the key indicator is the GDP per capita (a total value of goods and services produced by a nation during a year divided by its total population). It shows how rich each citizen is, on average, but unfortunately does not take into account differences in the cost of living in various parts of the world.
The richest countries in the world are graded by their sound and a healthy economy; not just in wealth alone, a country like HongKong has a high life expectancy .
For the most accurate measurement, economists use GDP based on Purchasing Power Parity, the so-called GDP (PPP) per capita. It calculates the total value of goods and services produced in each country as if they were sold at US prices. So we can compare nations with different standards of living by measuring their GDP (PPP) per capita in international dollars (equivalent to US dollar), and find out who is the richest of them.
The strong economy positively affects an average life expectancy in a country but does not influence people’s satisfaction with their lives, does not determine how happy are they. A Ranking of Happiness (based on the poll of real people from the different parts of the world) could give us an answer. Respondents evaluate own living conditions and happiness level on a scale from 0 to 10 points. On the basis of these data, the World Ranking of Happiness is formed (note that some microstates do not participate in the survey).List of the 50 richest countries ranked by GDP based on purchasing-power-parity (PPP) per capita
| Rank | Country | GDP(PPP) per capita2018 (Intl $) | Continent | Average Life Expectancy (years) | Happiness Ranking Rank 2018 (score) |
|---|---|---|---|---|---|
| 1 | Liechtenstein | 139,100 | Europe | 82.66 | no data |
| 2 | Qatar | 128,703 | Asia | 78.41 | 32 (6.374) |
| 3 | Monaco | 115,700 | Europe | 89.40 | no data |
| 4 | Luxembourg | 110,870 | Europe | 82.40 | 17 (6.910) |
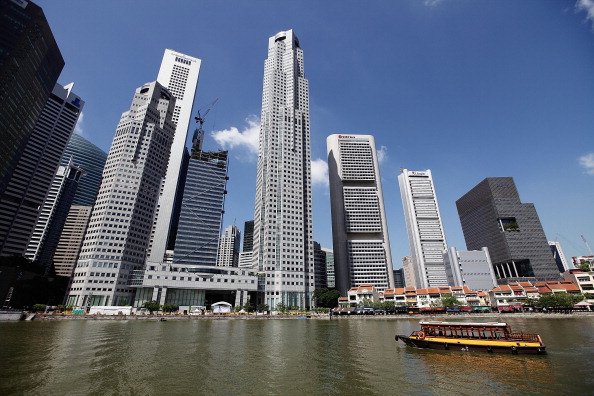
| 5 | Singapore | 98,014 | Asia | 83.30 | 34 (6.343) |
| 6 | Ireland | 79,925 | Europe | 81.71 | 14 (6.977) |
| 7 | Brunei | 79,726 | Asia | 77.49 | no data |
| 8 | Norway | 74,065 | Europe | 82.39 | 02 (7.594) |
| 9 | United Arab Emirates | 68,662 | Asia | 77.49 | 20 (6.774) |
| 10 | Kuwait | 66,673 | Asia | 74.87 | 45 (6.083) |
| 11 | Switzerland | 63,380 | Europe | 83.56 | 05 (7.487) |
| 12 | United States | 62,152 | North America | 79.62 | 18 (6.886) |
| 13 | San Marino | 61,169 | Europe | 83.48 | no data |
| 14 | Netherlands | 56,436 | Europe | 82.06 | 06 (7.441) |
| 15 | Saudi Arabia | 55,859 | Asia | 74.80 | 33 (6.371) |
| 16 | Iceland | 54,121 | Europe | 82.99 | 04 (7.495) |
| 17 | Sweden | 53,078 | Europe | 82.70 | 08 (7.324) |
| 18 | Germany | 52,801 | Europe | 81.27 | 15 (6.965) |
| 19 | Taiwan | 52,305 | Asia | 80.26 | 26 (6.441) |
| 20 | Australia | 52,191 | Australia and Oceania | 83.15 | 10 (7.272) |
| 21 | Austria | 51,936 | Europe | 81.86 | 12 (7.139) |
| 22 | Denmark | 51,643 | Europe | 80.91 | 03 (7.555) |
| 23 | Bahrain | 50,103 | Asia | 77.11 | 43 (6.105) |
| 24 | Andorra | 49,900 | Europe | 82.91 | no data |
| 25 | Canada | 49,775 | North America | 82.76 | 07 (7.328) |
| 26 | Belgium | 48,258 | Europe | 81.39 | 16 (6.927) |
| 27 | Finland | 46,343 | Europe | 81.57 | 01 (7.632) |
| 28 | Oman | 45,723 | Asia | 77.37 | no data |
| 29 | United Kingdom | 45,566 | Europe | 81.77 | 19 (6.814) |
| 30 | France | 45,474 | Europe | 82.80 | 23 (6.489) |
| 31 | Malta | 44,670 | Europe | 81.09 | 22 (6.627) |
| 32 | Japan | 44,426 | Asia | 83.98 | 54 (5.915) |
| 33 | South Korea | 41,388 | Asia | 82.44 | 57 (5.875) |
| 34 | Spain | 40,290 | Europe | 83.36 | 36 (6.310) |
| 35 | New Zealand | 40,118 | Australia and Oceania | 82.98 | 08 (7.324) |
| 36 | Italy | 39,500 | Europe | 83.26 | 47 (6.000) |
| 37 | Cyprus | 38,980 | Europe | 80.74 | 61 (5.762) |
| 38 | Israel | 37,673 | Asia | 82.74 | 11 (7.190) |
| 39 | Czechia | 37,546 | Europe | 78.93 | 21 (6.711) |
| 40 | Slovenia | 36,566 | Europe | 81.15 | 51 (5.948) |
| 41 | Slovakia | 35,095 | Europe | 77.26 | 39 (6.173) |
| 42 | Lithuania | 34,596 | Europe | 74.77 | 50 (5.952) |
| 43 | Estonia | 33,842 | Europe | 77.69 | 63 (5.739) |
| 44 | Equatorial Guinea | 32,855 | Africa | 59.48 | no data |
| 45 | Bahamas | 32,283 | North America | 75.89 | no data |
| 46 | Trinidad and Tobago | 32,011 | North America | 70.82 | 38 (6.192) |
| 47 | Portugal | 31,965 | Europe | 81.52 | 77 (5.410) |
| 48 | Poland | 31,430 | Europe | 77.82 | 42 (6.123) |
| 49 | Hungary | 31,370 | Europe | 76.08 | 69 (5.620) |
| 50 | Malaysia | 30,858 | Asia | 75.52 | 35 (6.32) |


